Two month ago I did first look on defaults in my BTCJAM portfolio (BTCJAM: Very short about bad loans in my portfolio. Aug2016 . ). I made a promise to look more precisely what are biggest problems. Now I put small infrastructure to collect history of loan and did few very first graphs.
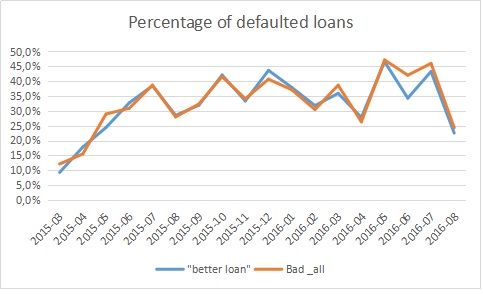
 Graph above demonstrates percentage of defaulted loans in my portfolio. I count number of defaults (not lost value). My portfolio consist two parts. I do not invest more than 0.01 BTC in loans where I feel bigger risk or bigger uncertainty in borrower. Orange line presents total rate of defaulted loans. Blue line present rate of defaults in more trusted borrowers.
When we look on these date, we need to count, that some of defaulted borrowers have repaid bigger or some part of loan. Not every case is 100% loss.
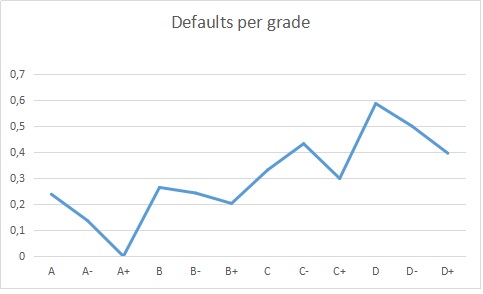
Below is distribution of defaults in my portfolio per risk grade.
 I have only 6 D- cases, so this may be not enough to get trusted value. As opposite I have good number of A+ loans and rate of defaults there is zero. Interesting, that D+ in my portfolio performs better than C- or D. When I look at distribution in my worst month (2016 May-July) I can notice huge amount of defaulted C (all grades) and B loan.
We can look on distributor of defaults by currency.
 I have only 6 cases where loan issued in MXN, 8 cases with loan in INR and 9 cases with loan in RUB. So these data could be not statistically right.
This is first short look, therefore it is very simplified. I need to repeat, that these results are not applicable to whole BTCJAM portfolio and are valid only to my data.
I will try to add more points and will ask data from my colleague who do more safe investments. I also plan to try JAM autoinvest. All data will be presented in my latest posts.
Thank you in advance for any comments or suggestions.
I would suggest you to consider:
1 – Consider amount invested, it makes a huge difference. You may gain in a 0,2 loan and loose 0,02 in another. You did not loose 50%.
1.1 – When do you consider you loose? 1 day late makes full loan lost?
2 – Do you sell notes to reduce the loss? If so how do you calculate your loss?
3 – Grades. I understood the correct order should be A+ A A- B+ B B- …..
Thank you for comment!
1. My aim was to look which segment is most risky, then invested amount is not important. If I will look profit/loss per segment, then sure I need to look on invested amount.
2.When I calculate Return on investments I assume that 10% of late and defaulted loans will recover. Also, I calculate percentage of possible defaults in my current/future portfolio.
3. I almost do not sell notes as I do not have automated solution for this. I have over 2000 of loans, it is hard to sell in manual way. Also, I like to spend more time to understand what discount I need to offer to have an effective sell. I see that 90% discount – 4 digit yield 0 not always make note be sold
4. Yes, grades will be sorted better in next review. I did just first import of data. I will look data per country too