In previous article (Tracking result of investments) I have described general idea how is possible to calculate and monitor return on investments. Now I like to show how I do it for p2p lending at Bondora (www.bondora.com). Bondora is incredible slow several last days, that gives me time to write this post.
I took initial idea of measurement from old Bondora forum at very beginning of my investments. At that time forum was quite interactive and even CEO of Bondora was actively participating in discussions. First question when I read about that measurement was “Why? Why do I need that 🙂 Bondora show me my ROI”. But after 16 month of investments I understand that not all is so simple.
I was very naive at the beginning and I was very lucky that Bondora (at that time Isepankur) were working in Estonia only. But late 2013 I started to invest in some Finnish loans, then a bit into Spanish and then a bit into Slovakian loans. The only what I was measuring at the beginning was basic data – amounts of investments and fast look at amount overdue. Last year I got bad surprise when I noticed a huge grow in overdue. I understood that I am already too late and data need serious attention. So I put much more efforts to understand data and track result.
Historically I have two accounts at Bondora. Let’s name them “Bigger” and “Risky”. That accounts started in February and September 2013. Additionally one of my colleagues have small account at Bondora. He allowed me to add his data for this demonstration. Last year he invest in Estonia only so I like to name his account “Safe”. That account started August 2013.
After Bondora cancelled old Portfolio Manager, I do all my investments manually. I do not use any bots. The same with my colleague, he is doing only manual investments following my recommendations.
Below are return indicators provided by Bondora.
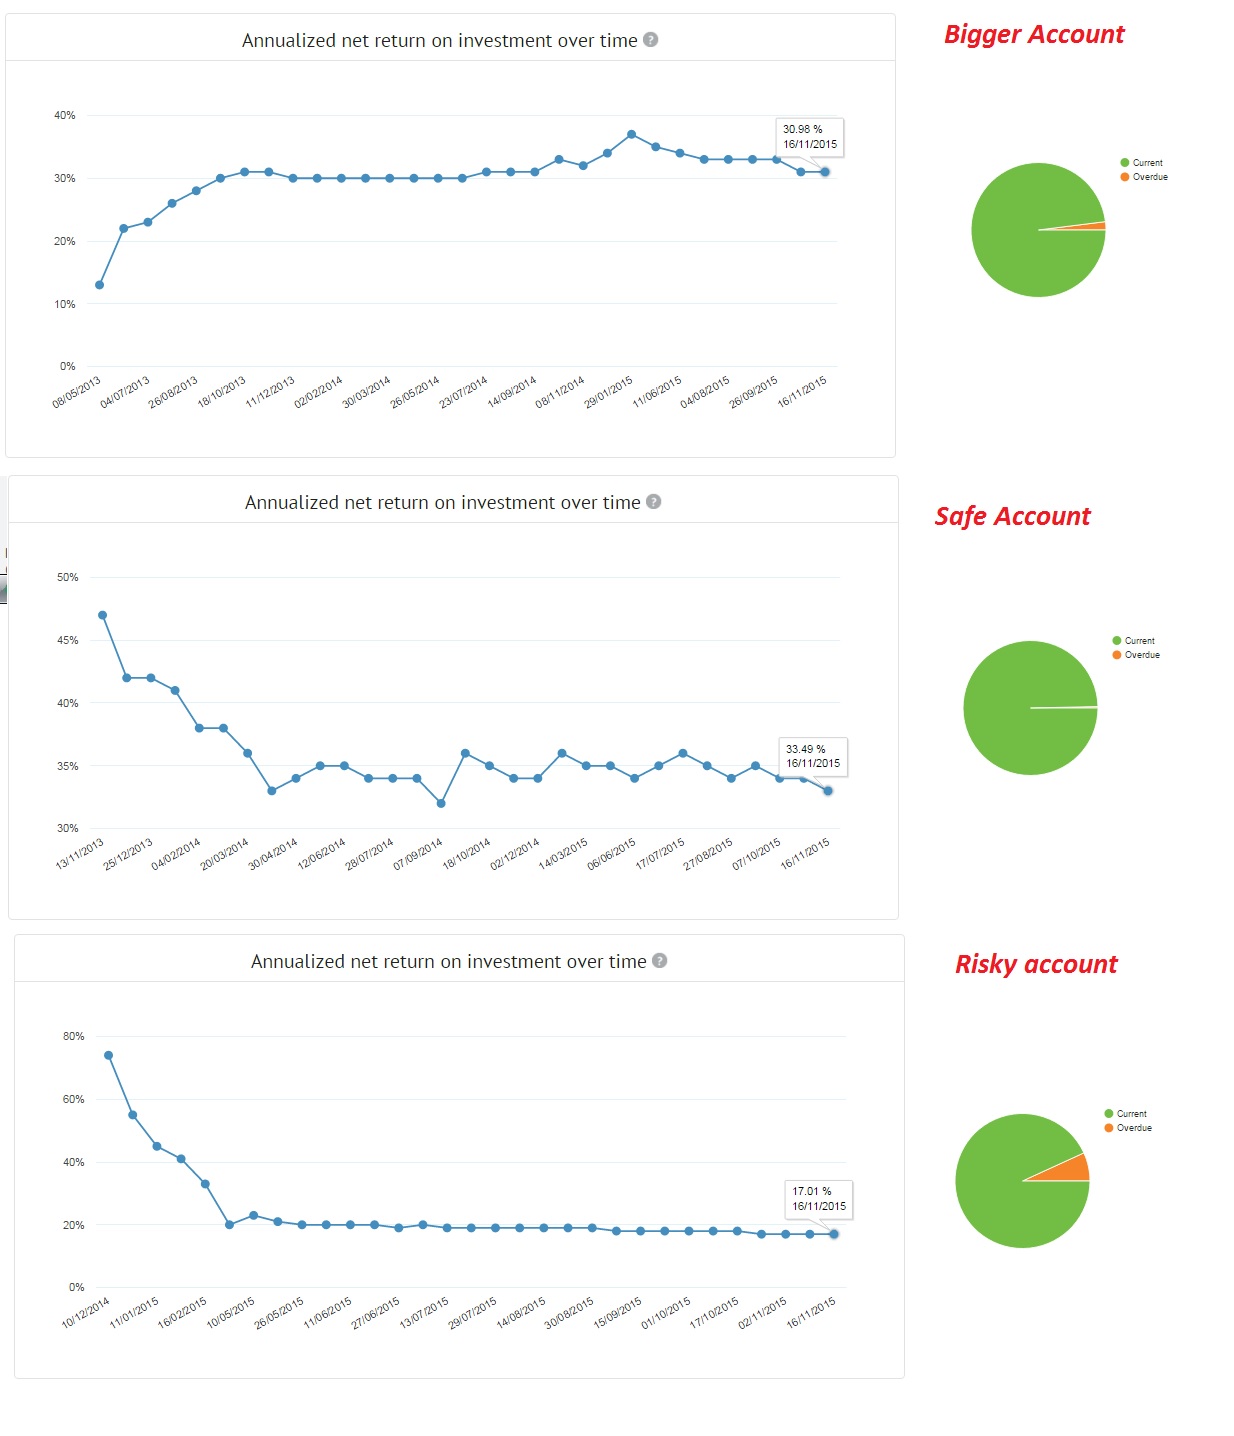
Overall, by Bondora I am in top 10 of investors who invested over 10K€ at Bondora over last 24month. That is probably true. Bondora show me quite nice result, which is far bigger than 15%. I must be happy, but in my opinion, this is not so simple…
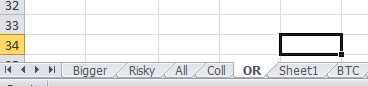 In Excel I have 2 sheets where I enter data per portfolio plus aggregated sheet where I look on combined result. To do this presentation I have added one more sheet to store data from my colleague. You can see that in the same Excel I have place to measure result from my Omaraha and Bitcoin investments.
I enter all dates and amounts of deposits and withdraw like describer in Tracking result of investments.
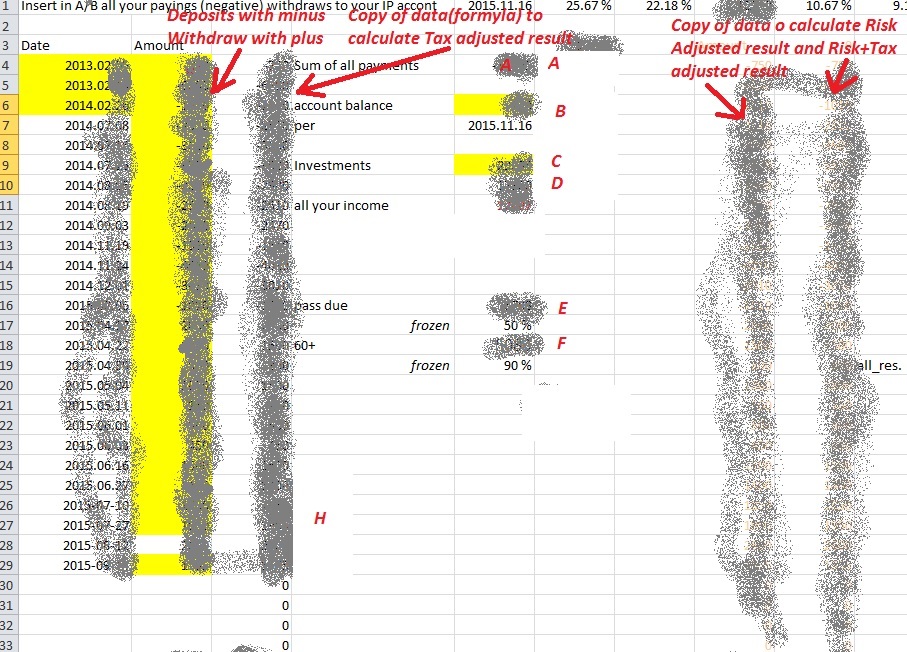
I am not expert with Excel, I do not know if I can enter data once and calculate several different XIRR. So I did manually 3 copies of deposit/withdraw column. At bottom of each columns I have XIRR formula that measures:
- XIRR,
- Tax_Adjusted_XIRR,
- Risk_Adjusted_XIRR and
- Risk_And_Tax_Adjusted_XIRR.
Yes, I pay taxes and like to sleep safe 🙂
Last two indicators are the most interesting and useful – one demonstrates “realistic” return from investments and last one show you what is your real “green” return after taxes.

Cell A is simple sum of my deposits/withdraw.
Cell B is Amount of Cash+Cash reserved for investments. I get that amounts from Dashboard (Available+Reserved).
Cell C is Current(well performing) + Overdue +Defaulted(60+) amounts. Today it is equal Outstanding Principal from Dashboard.
Since November Bondora do not to display amounts of overdue and defaulted loans in simple and visible way. So, I need to go to My Investments, filter Overdue or 60+ Overdue and find sum in total line.
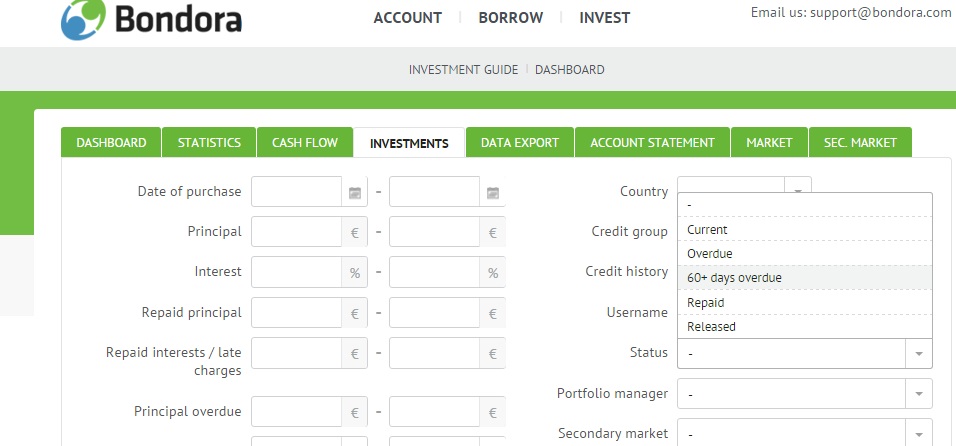
and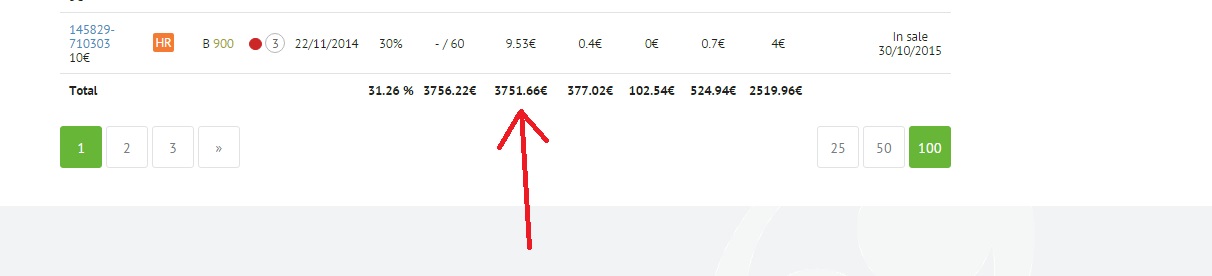
As you see, what I name a ‘real amount’ of defaulted loans (3751€) is very far from 524€ displayed in Dashboard.
To calculate “realistic” scenario of return, I use “exit today” strategy: I assume that if I like to quit from Bondora in next few days, it is quite realistic that I can sell all my overdue at 50% discount and I can sell all my defaulted loans at 90% (if you start today, I would recommend to use 65-75% as average discount to sale defaulted loans). That values are placed in Cell E and F.
So, to calculate Risk_Adjusted_Portfolio_Value I use such formula
Risk_Adjusted_Portfolio_Value = B x 100% + C – E x 50% -F x 90%.
If I need to calculate Tax Adjusted value I use
[C-A] x Tax_Rate
as simplified value of income tax. In my example income tax is 15% so, I am getting
Tax_Risk_ Adjusted_Portfolio_Value = B x 100% + C – E x 50% -F x 90% -[C-A] x 15%
In my Excel I have COPY line where I have predefined formulas to simple copy into one line following values:
Date,
Return_XIRR (XIRR without adjustments),
Tax_Adjusted_Return_XIRR,
Risk_ Adjusted_Portfolio_Value_XIRR
Tax_Risk_ Adjusted_Portfolio_Value_XIRR
Profit=Portfolio_Today – Invested_Amount,
Overdue_Amount
Overdue_Rate = C/E
Defaulted Amount
Defaulted Rate = C/D
I do Copy/Paste of my COPY_LINE values into “Historical area” in my Excel. There I am calculating additionally (predefined formulas)
Month_Profit=Current month Profit – Profit from last month
Change in Rate of Overdue (%)
Change in Rate of Defaulted (%)
My HISTORICAL AREA looks like
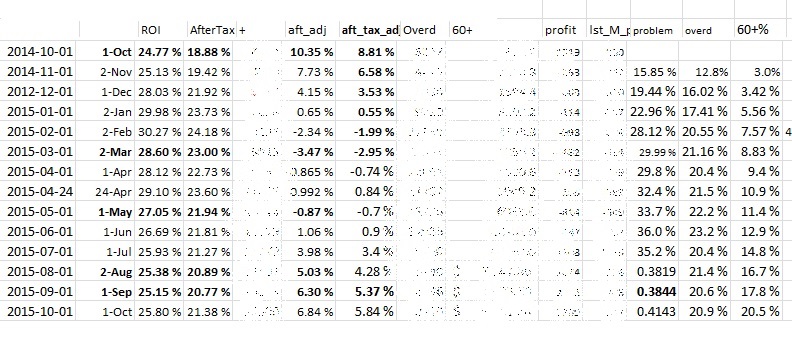
You may see that my ROI (about 6%) is far from displayed by Bondora. I was very close to get extremely negative result (start of this year) and only change in strategy Autumn 2014 together with deep analyze of data allowed me to change negative trend. I hope that ROI will grow, but not sure how it will be after Bondora will stop manual investments.
Collected data allows me to make different graphs. Some examples:
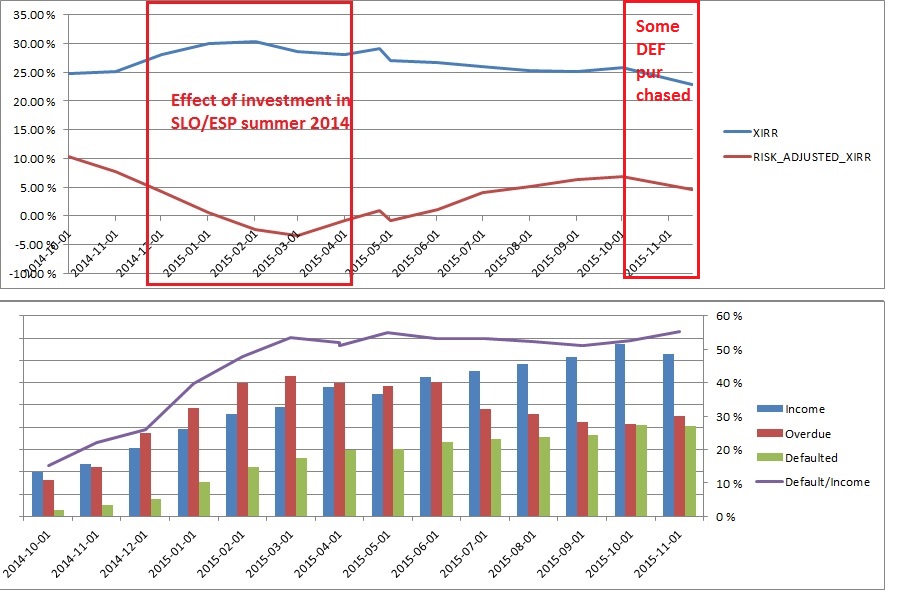
Like told in previous post – Excel gives you a lot of possibilities, so graphs and dimensions may be very different. Most important is to track regulary and be consistent in your dimensions/values.
Wish you nice and useful mining within your results!
What recommendations did you give to your colleague about chosing investments in Bondora?
If you will look my last posts you will note that return on “safe” portfolio went down. I do not know is it temporary or not.
Recommendations are changing all the time. 2y ago it was simple – -Estonia and love C1000. But today recommendation can be very different. I think importance of country decreased, especially within AA-D rating. I need to check that. I was moving Bondora portfolio down and was spending much less time on analyse. Now, after changes at Twino and some communication form Bondora side, I will probably look on Bondora more carefully